
Well Rehabilitation Oct 14, 2026, 10:33:48 AM AirBurst Experts 9 min read
Short answer: A trustworthy pump test starts from a fully rested well, holds the pumping rate steady within a few percent, measures flow and water level on the same clock against a documented reference point, and is repeated the same way every time. Use a step-drawdown test to separate well loss from aquifer loss and calculate well efficiency (90% or better is clean; the 50s or 60s point to a plugged screen or pack). Use a constant-rate test at the operating rate for the headline specific capacity and to see aquifer boundaries. Get either one wrong and every number built on it, specific capacity, wire-to-water efficiency, the whole justification for a rehab, is quietly and confidently wrong.
Garbage in, garbage out (except the garbage is wearing a suit)
A bad pump test does not announce itself. It hands you numbers that look perfectly reasonable and are quietly, confidently wrong.
Almost every number that matters in well rehabilitation, specific capacity, well efficiency, wire-to-water efficiency, specific energy, and the before-and-after case you hand a client, is built on the foundation of a pump test. If you learn nothing else, learn to run a test you can trust.
Choosing the test
There are three workhorse tests, and picking the right one depends on what question you are asking.
Step-drawdown test. Pump at several increasing rates, holding each one steady for a set period and recording the drawdown at each. This is the test that separates well losses from aquifer losses and reveals well efficiency. It is also how you responsibly pick the rate for a longer test.
Constant-rate test. Pump at one steady rate for an extended period, hours to days, and watch how drawdown develops and, ideally, how neighboring wells respond. This is your best window into the aquifer itself: transmissivity, boundaries, and whether it can sustain the demand. It is also the cleanest apples-to-apples test to repeat for tracking specific capacity across the years.
Variable-rate test. Real-world conditions where the rate changes, sometimes because you are working around an operating facility, sometimes because you are mining SCADA history rather than running a controlled test. Harder to interpret, but with a continuous, timestamped record of rate and drawdown it can still be analyzed by superposition. Treat it as a fallback, not a first choice.
If the aquifer is not well understood, a step test first is the professional move.
If we're sizing a new pump, first run the step-drawdown test to find a candidate pumping rate, then run a long-duration constant test to confirm it.
The step-drawdown test, in depth
Design. Use four or five steps that bracket your intended operating rate, from below it to above it. Keep the steps equal in length, often 60 to 120 minutes each, long enough for drawdown to nearly stabilize. Hold each rate steady within a few percent. Never push a step past the drawdown the well or the pump's submergence can handle.
What it separates. Total drawdown (s) in a pumping well is two things stacked together:
s = BQ + CQ²
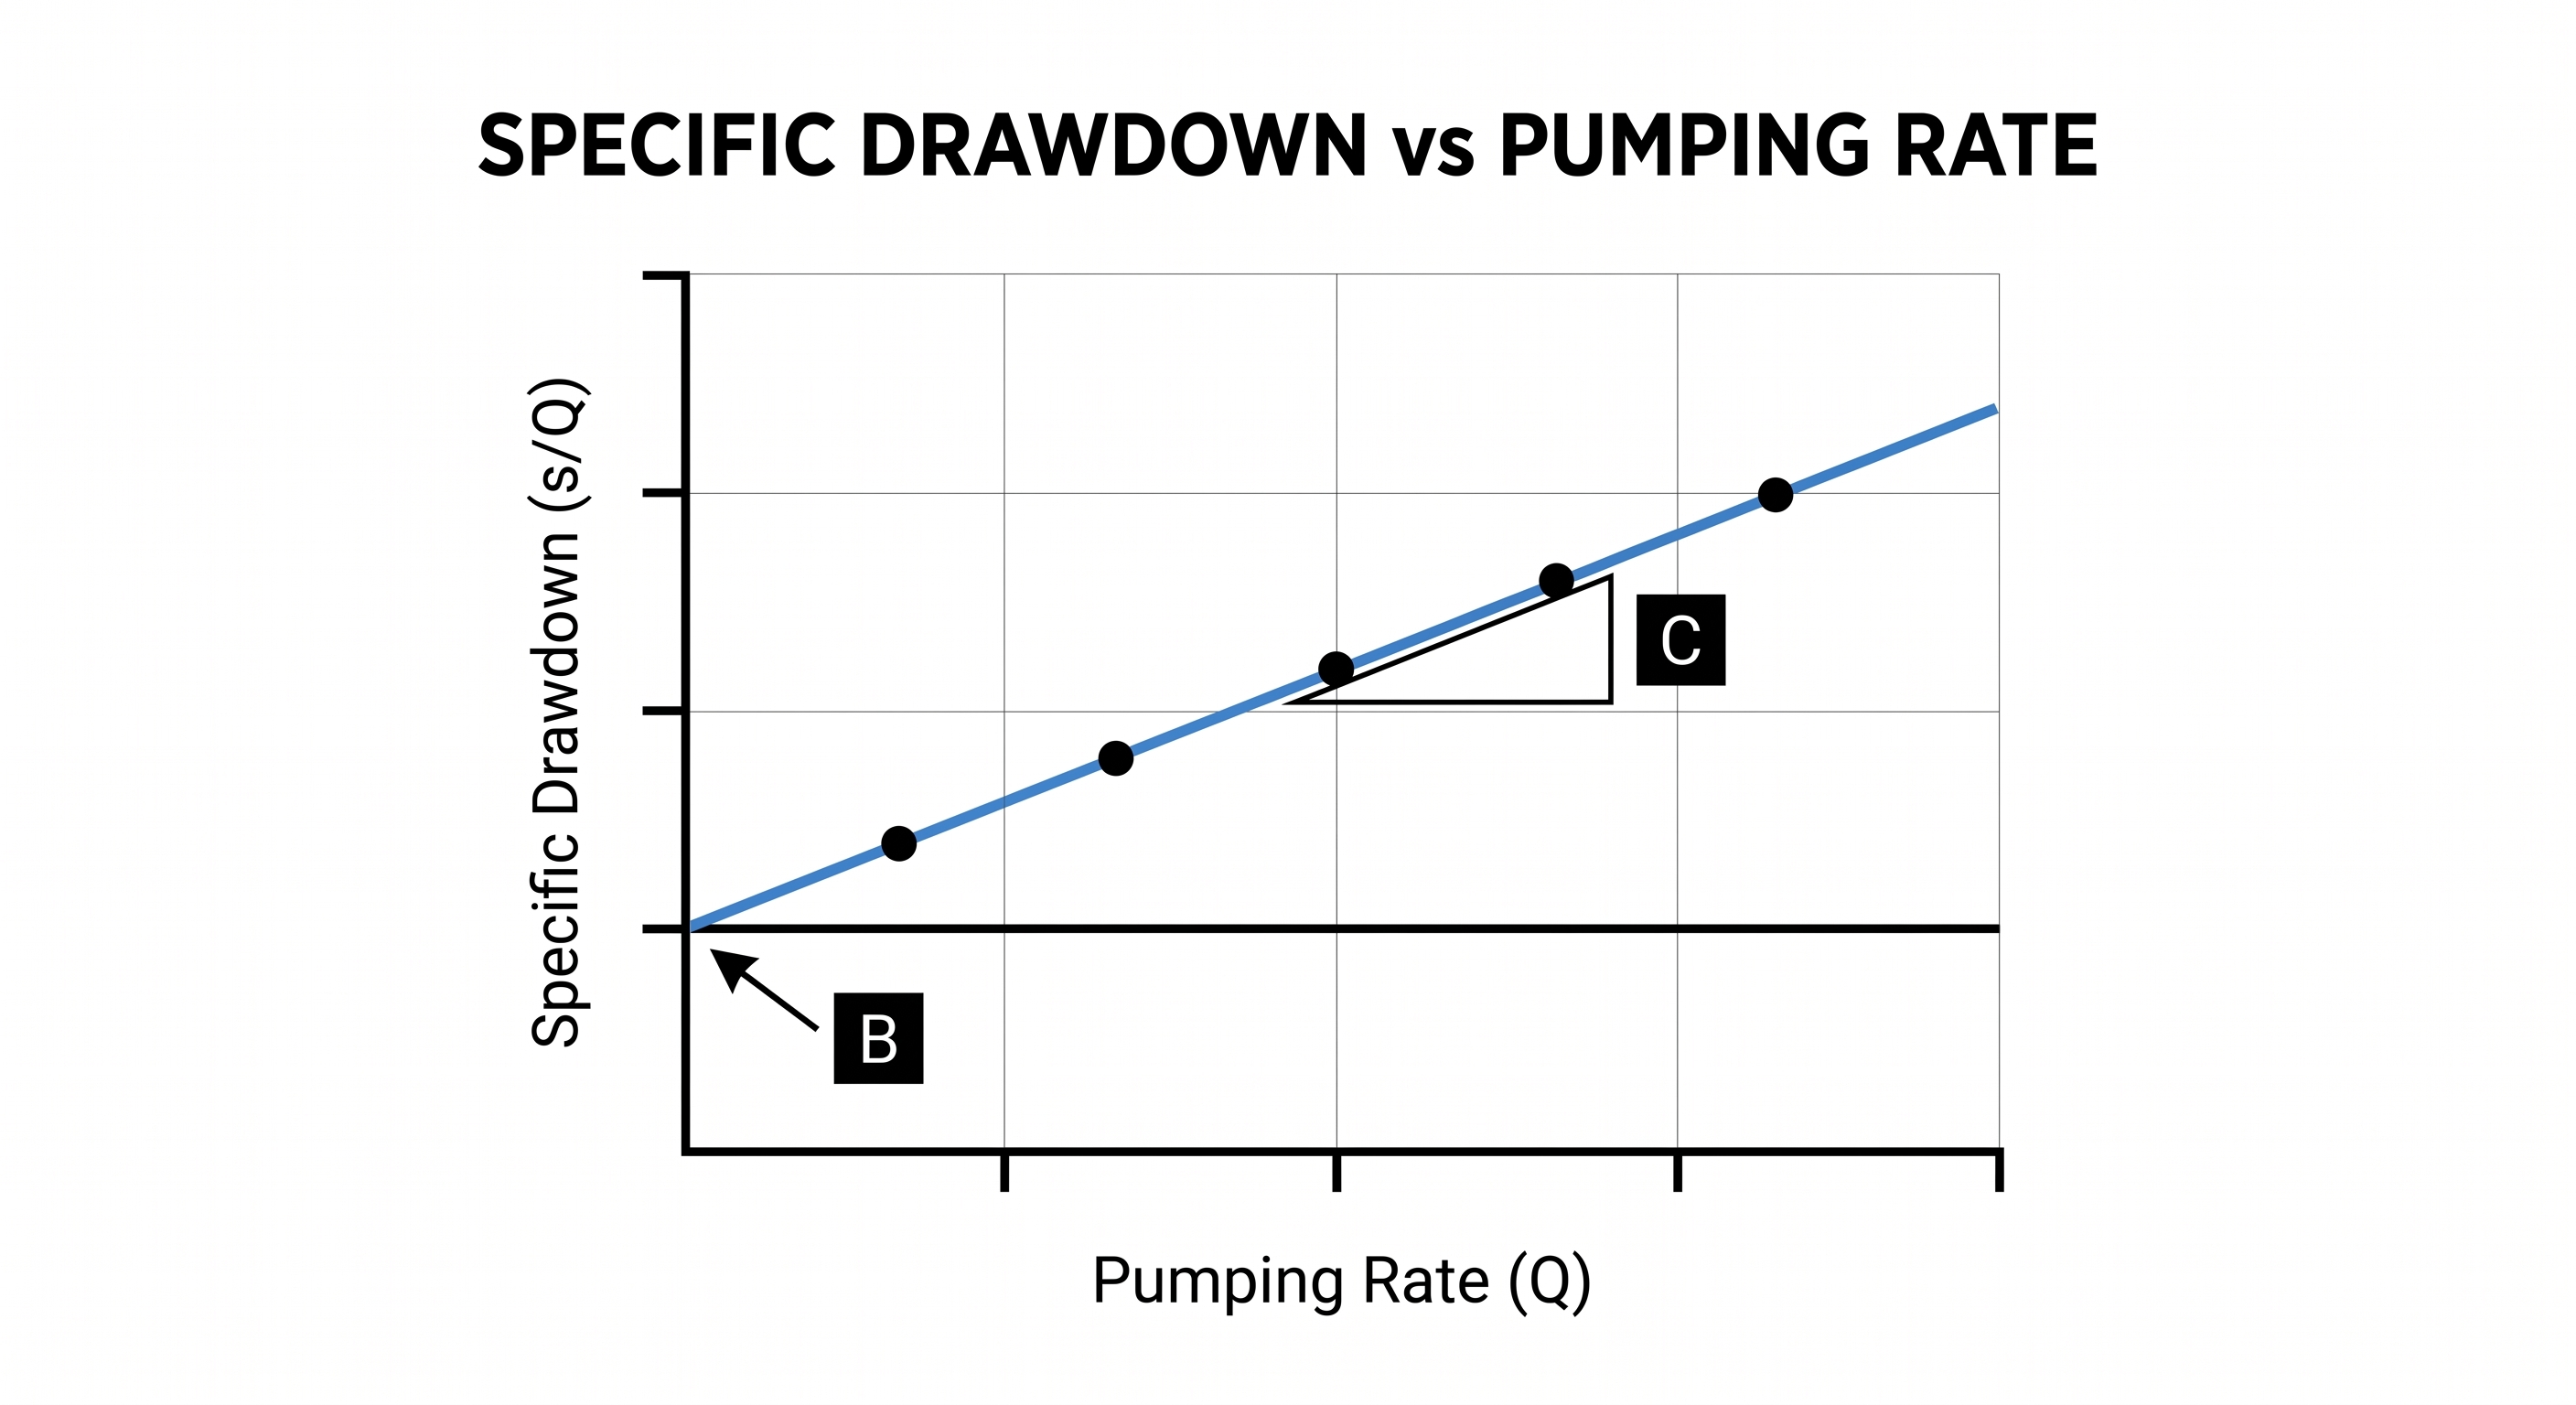
The BQ term is aquifer loss, laminar flow through the formation, which grows linearly with the pumping rate. It is physics, not your fault, and no rehab will ever fix it. The CQ² term is well loss, turbulent flow through the screen, gravel pack, and up the casing, which grows with the square of the rate. On an aging production well, that second bucket is overwhelmingly plugging: mineral scale, biofilm, and sediment choking the screen slots, the filter pack, and the formation right at the borehole wall. It is the only bucket a rehab can sell against, which is exactly why separating the two matters.
The analysis. Fit that equation across your steps, or use the classic shortcut: plot specific drawdown (s ÷ Q) against Q. The points fall on a straight line whose intercept is B (aquifer loss) and whose slope is C (well loss). Well efficiency at any rate is BQ ÷ (BQ + CQ²). Eighty percent or better means a clean, well-developed well; the 50s or 60s point to a plugged screen or pack, which is exactly what a rehab targets. Note that specific drawdown is just the reciprocal of specific capacity.
This is Jacob's well-loss equation, from C. E. Jacob's 1947 paper on drawdown in a pumped well, and the straight-line plot is the Hantush-Bierschenk graphical method you will find in every pumping-test manual. For the curious, Rorabaugh (1953) argued the exponent should not be locked at 2 and generalized it to s = BQ + CQⁿ, with n typically between about 1.5 and 3.5. It fits some wells better but rarely changes the decision you are about to make.
Common errors. Steps too short to stabilize. Not resting the well before you start. Unequal step lengths. Never reaching the real operating rate. Forgetting that drawdown carries over from one step to the next and must be accounted for in the analysis.
One trap worth naming. A boundary or dewatering reached on your higher, later steps can masquerade as well loss and understate the well's efficiency. Catch it with an observation well (which feels the aquifer but never the well loss), with a time-drawdown curve that bends rather than simply offsetting, or by repeating a low step to see whether it still lands on its original specific drawdown. But do not overthink it like a hydrogeologist. For a contractor, the loudest and most reliable signal is simply whether the well can still sustain the high flow rates it used to. If it cannot, that is your headline.
The constant-rate test, in depth
Design. Pick a rate you can actually hold for the full test (the step test tells you what is safe) without dewatering the well. Run it long enough to see late-time behavior and any boundaries. Measure recovery after shutdown. Log any observation wells on the same clock.
Common errors. Rate drift. A duration too short to reveal boundaries. Uncontrolled neighbor pumping. No recovery data. And, once again, a well that was not rested before the test began.
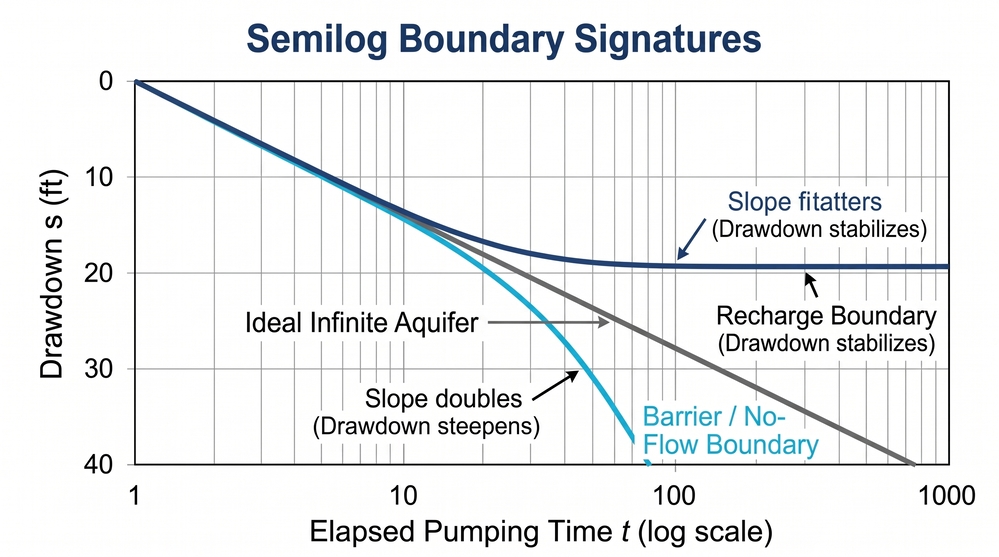
Reading boundaries. Plot drawdown against the logarithm of time and an ideal, infinite aquifer draws a straight line. A boundary breaks that line, and the direction tells you which kind you have hit:
- A barrier or no-flow boundary (an impermeable fault, the edge of the aquifer, or a neighbor's cone reaching yours) makes the slope steepen, classically doubling. Drawdown that was leveling off starts falling again and will not settle.
- A recharge boundary (a river, lake, or leaky connection feeding the well) flattens the slope and drawdown stabilizes.
Why it matters: a barrier boundary means the well's sustainable yield is lower than a short test would suggest, so size the pump, the available drawdown, and the duty cycle off the late-time behavior, and do not promise a demand the aquifer's geometry cannot support. A recharge boundary is good news. Either way, recognizing the boundary keeps you from blaming the well or the pump for drawdown the aquifer's shape is causing, which is how you avoid selling a rehab that a boundary-limited well was never going to reward.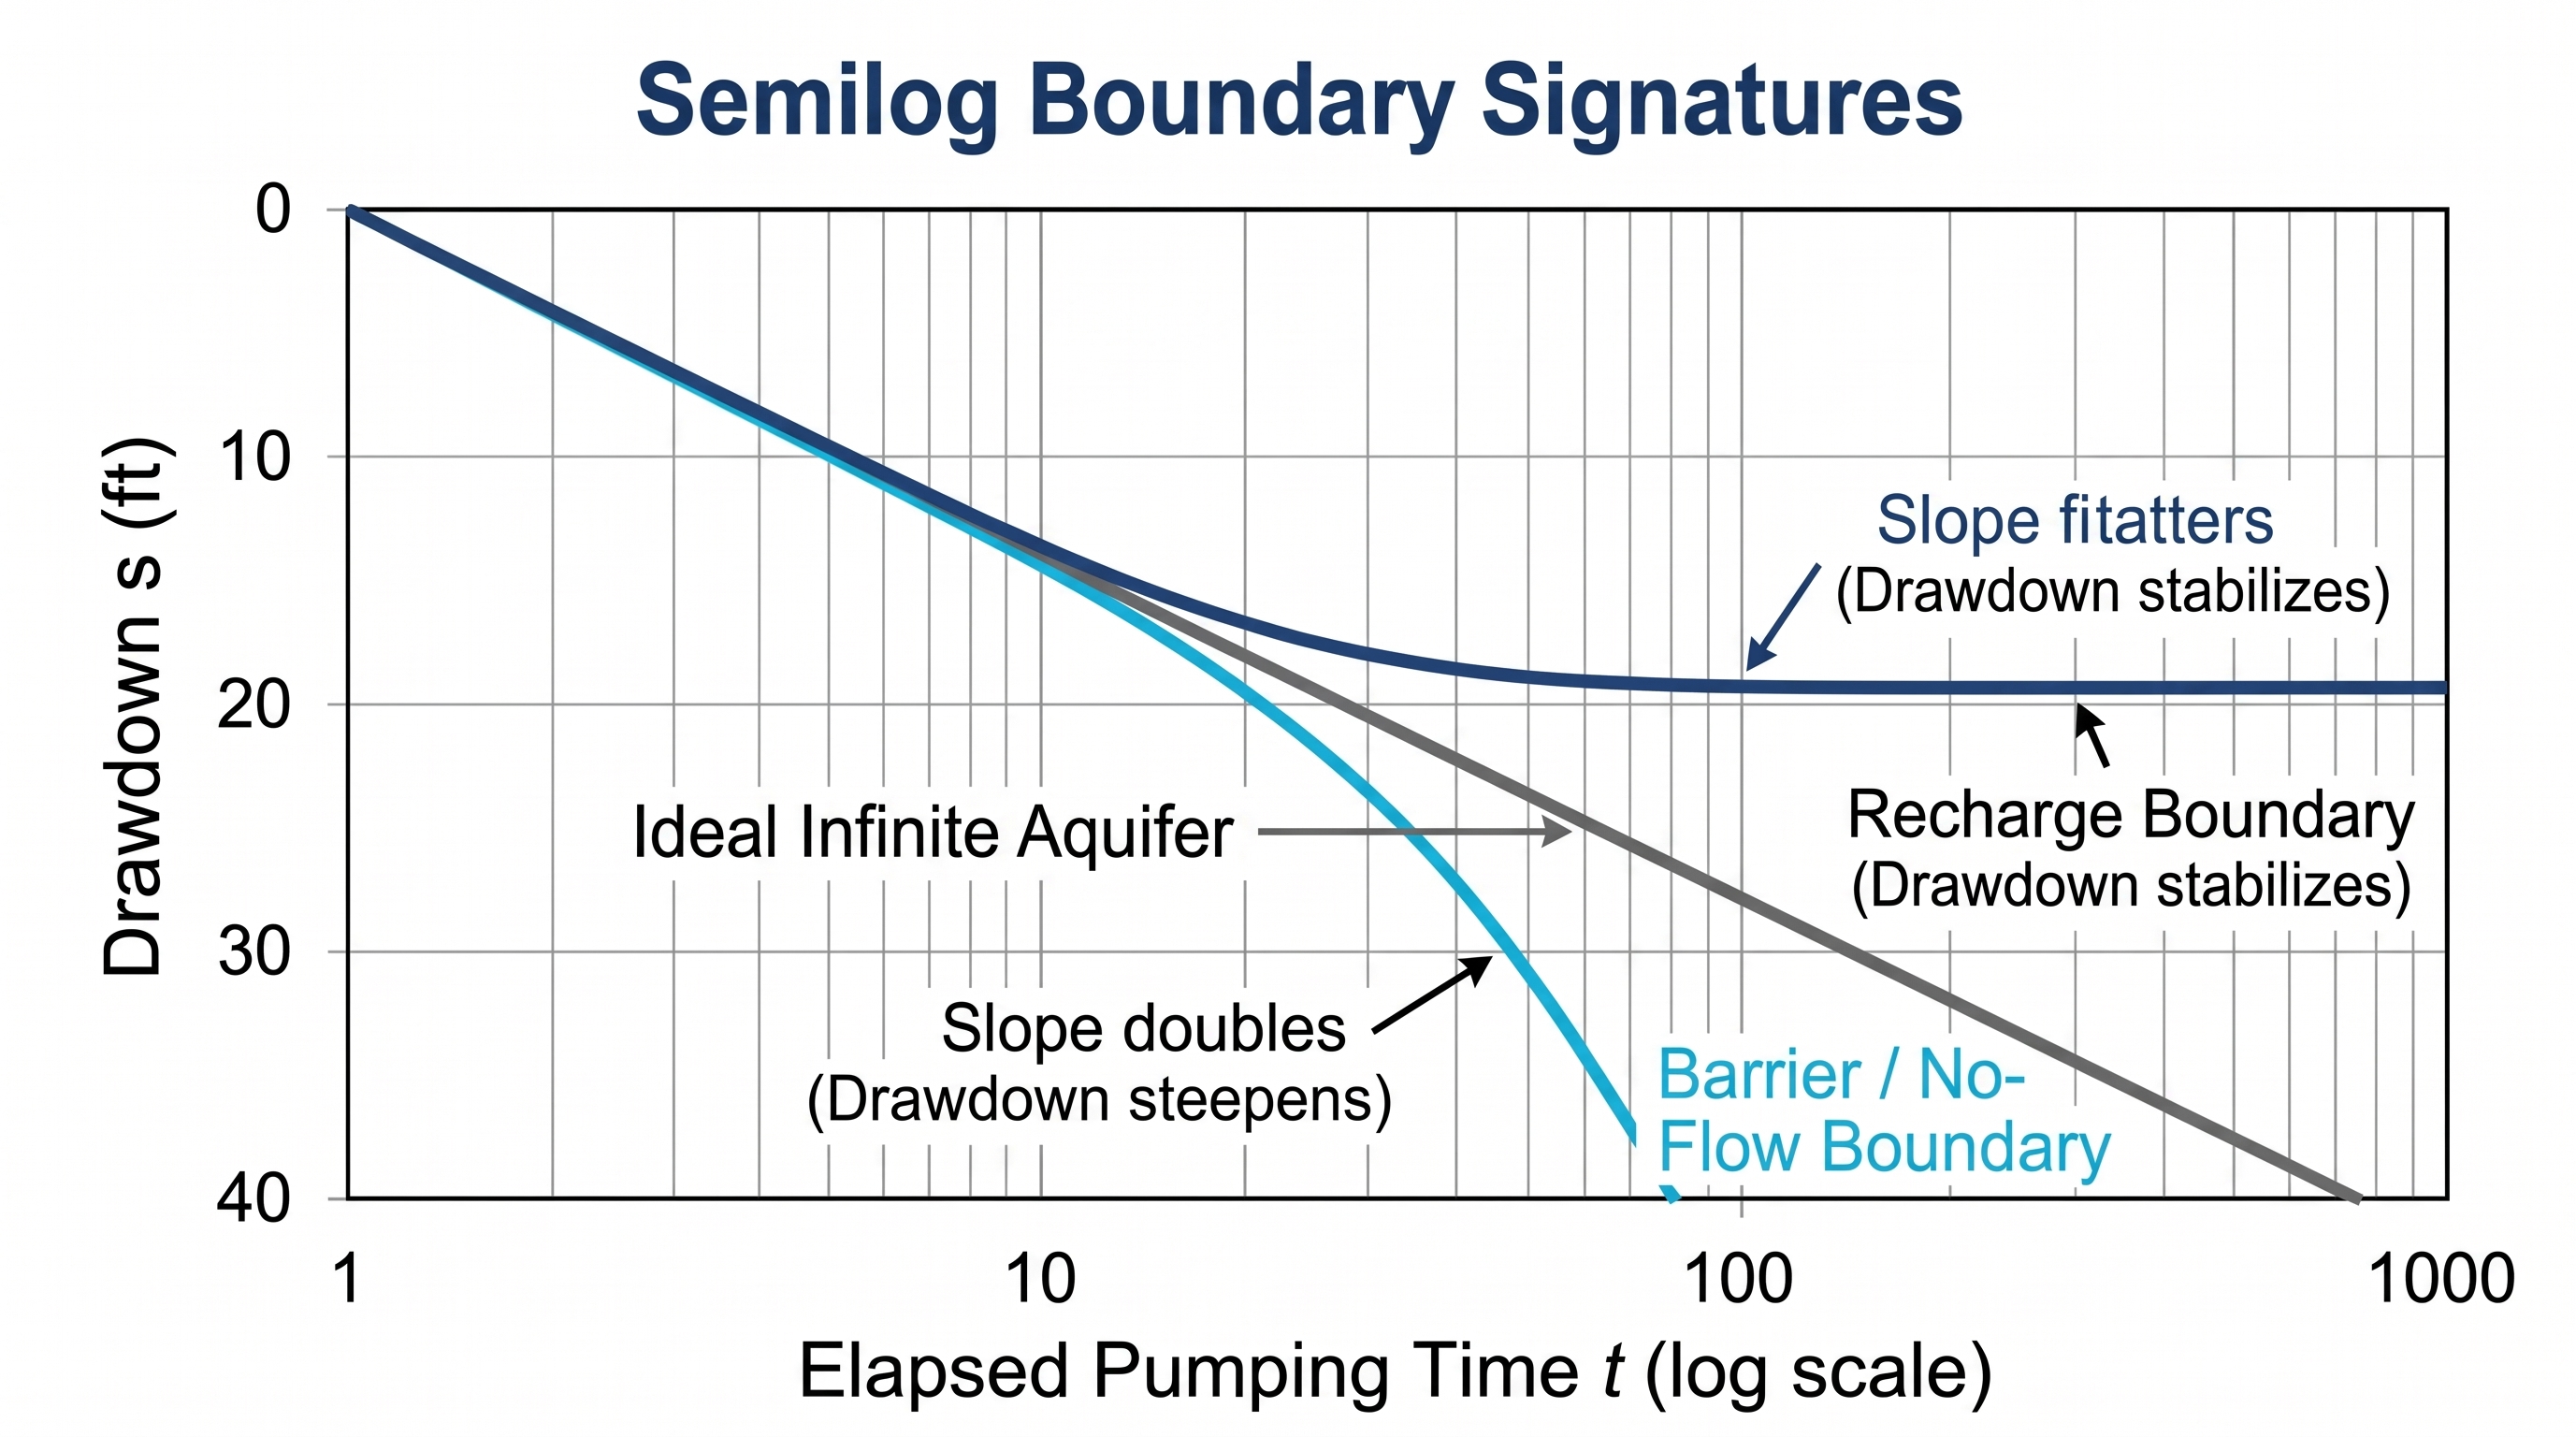
What "at rest" actually means
A meaningful test starts from a rested well, one whose water level has recovered to its true static level after the pump was shut off. Start pumping before the well has recovered and your static level is a lie, which makes your drawdown a lie, which makes your specific capacity a lie. The dominoes fall fast.
How long is long enough? It depends on the well and the aquifer. A high-transmissivity sand-and-gravel well might recover in an hour or two; a tight bedrock or deep sandstone well can need many hours to a full day. You do not guess. You measure the water level as it recovers and watch for it to stabilize. When it stops rising meaningfully, you are at rest. Record that same rest period every time so future tests match. If the well was recently hydrofractured, wait substantially longer, potentially up to a week, for the fracturing water to clear.
The 24/7 problem. Some wells never rest: dry-season irrigation, a facility with no backup. A well that has never had a real chance to recover makes it genuinely hard to know its true static level, which quietly corrupts everything downstream. Flag it loudly in your report and do everything you can to arrange a controlled shutdown before testing. Do not pretend a number is solid when the well never sat still long enough to give you one.
Mind the zone of influence
When you pump a well, you create a cone of depression radiating outward. If a neighbor's well sits inside that zone of influence and is pumping during your test, the two cones overlap and your "well" data is really "well plus whatever the neighbor was doing that afternoon."
Two field-friendly estimates of the radius of influence:
- Sichardt (steady-state rule of thumb): R = 3000 × s × √K, where R is in meters, s is drawdown at the well in meters, and K is hydraulic conductivity in meters per second. Quick and crude. One trap: the 3,000 coefficient is metric-only. Feed it feet and feet per day and your answer will be off by orders of magnitude.
- Time-dependent (Theis / Cooper-Jacob): R = √(2.25 × T × t ÷ S), where T is transmissivity, t is elapsed pumping time, and S is storativity, in consistent units. This captures the key truth that the cone keeps growing with pumping time.
Treat both as order-of-magnitude guides for planning which neighbors to take offline. The gold standard is empirical: watch for drawdown response in nearby observation wells. Whenever possible, get the neighbors offline, or at least documented, and keep that arrangement consistent from test to test. If well #3 down the road was off during your baseline three years ago, it should be off today.
Measuring flow
A test is only as good as its two core measurements. For flow:
- Calibrated in-line flow meter. The gold standard for permanent installations and high-production wells. Confirm it is actually calibrated and not reading 15% off.
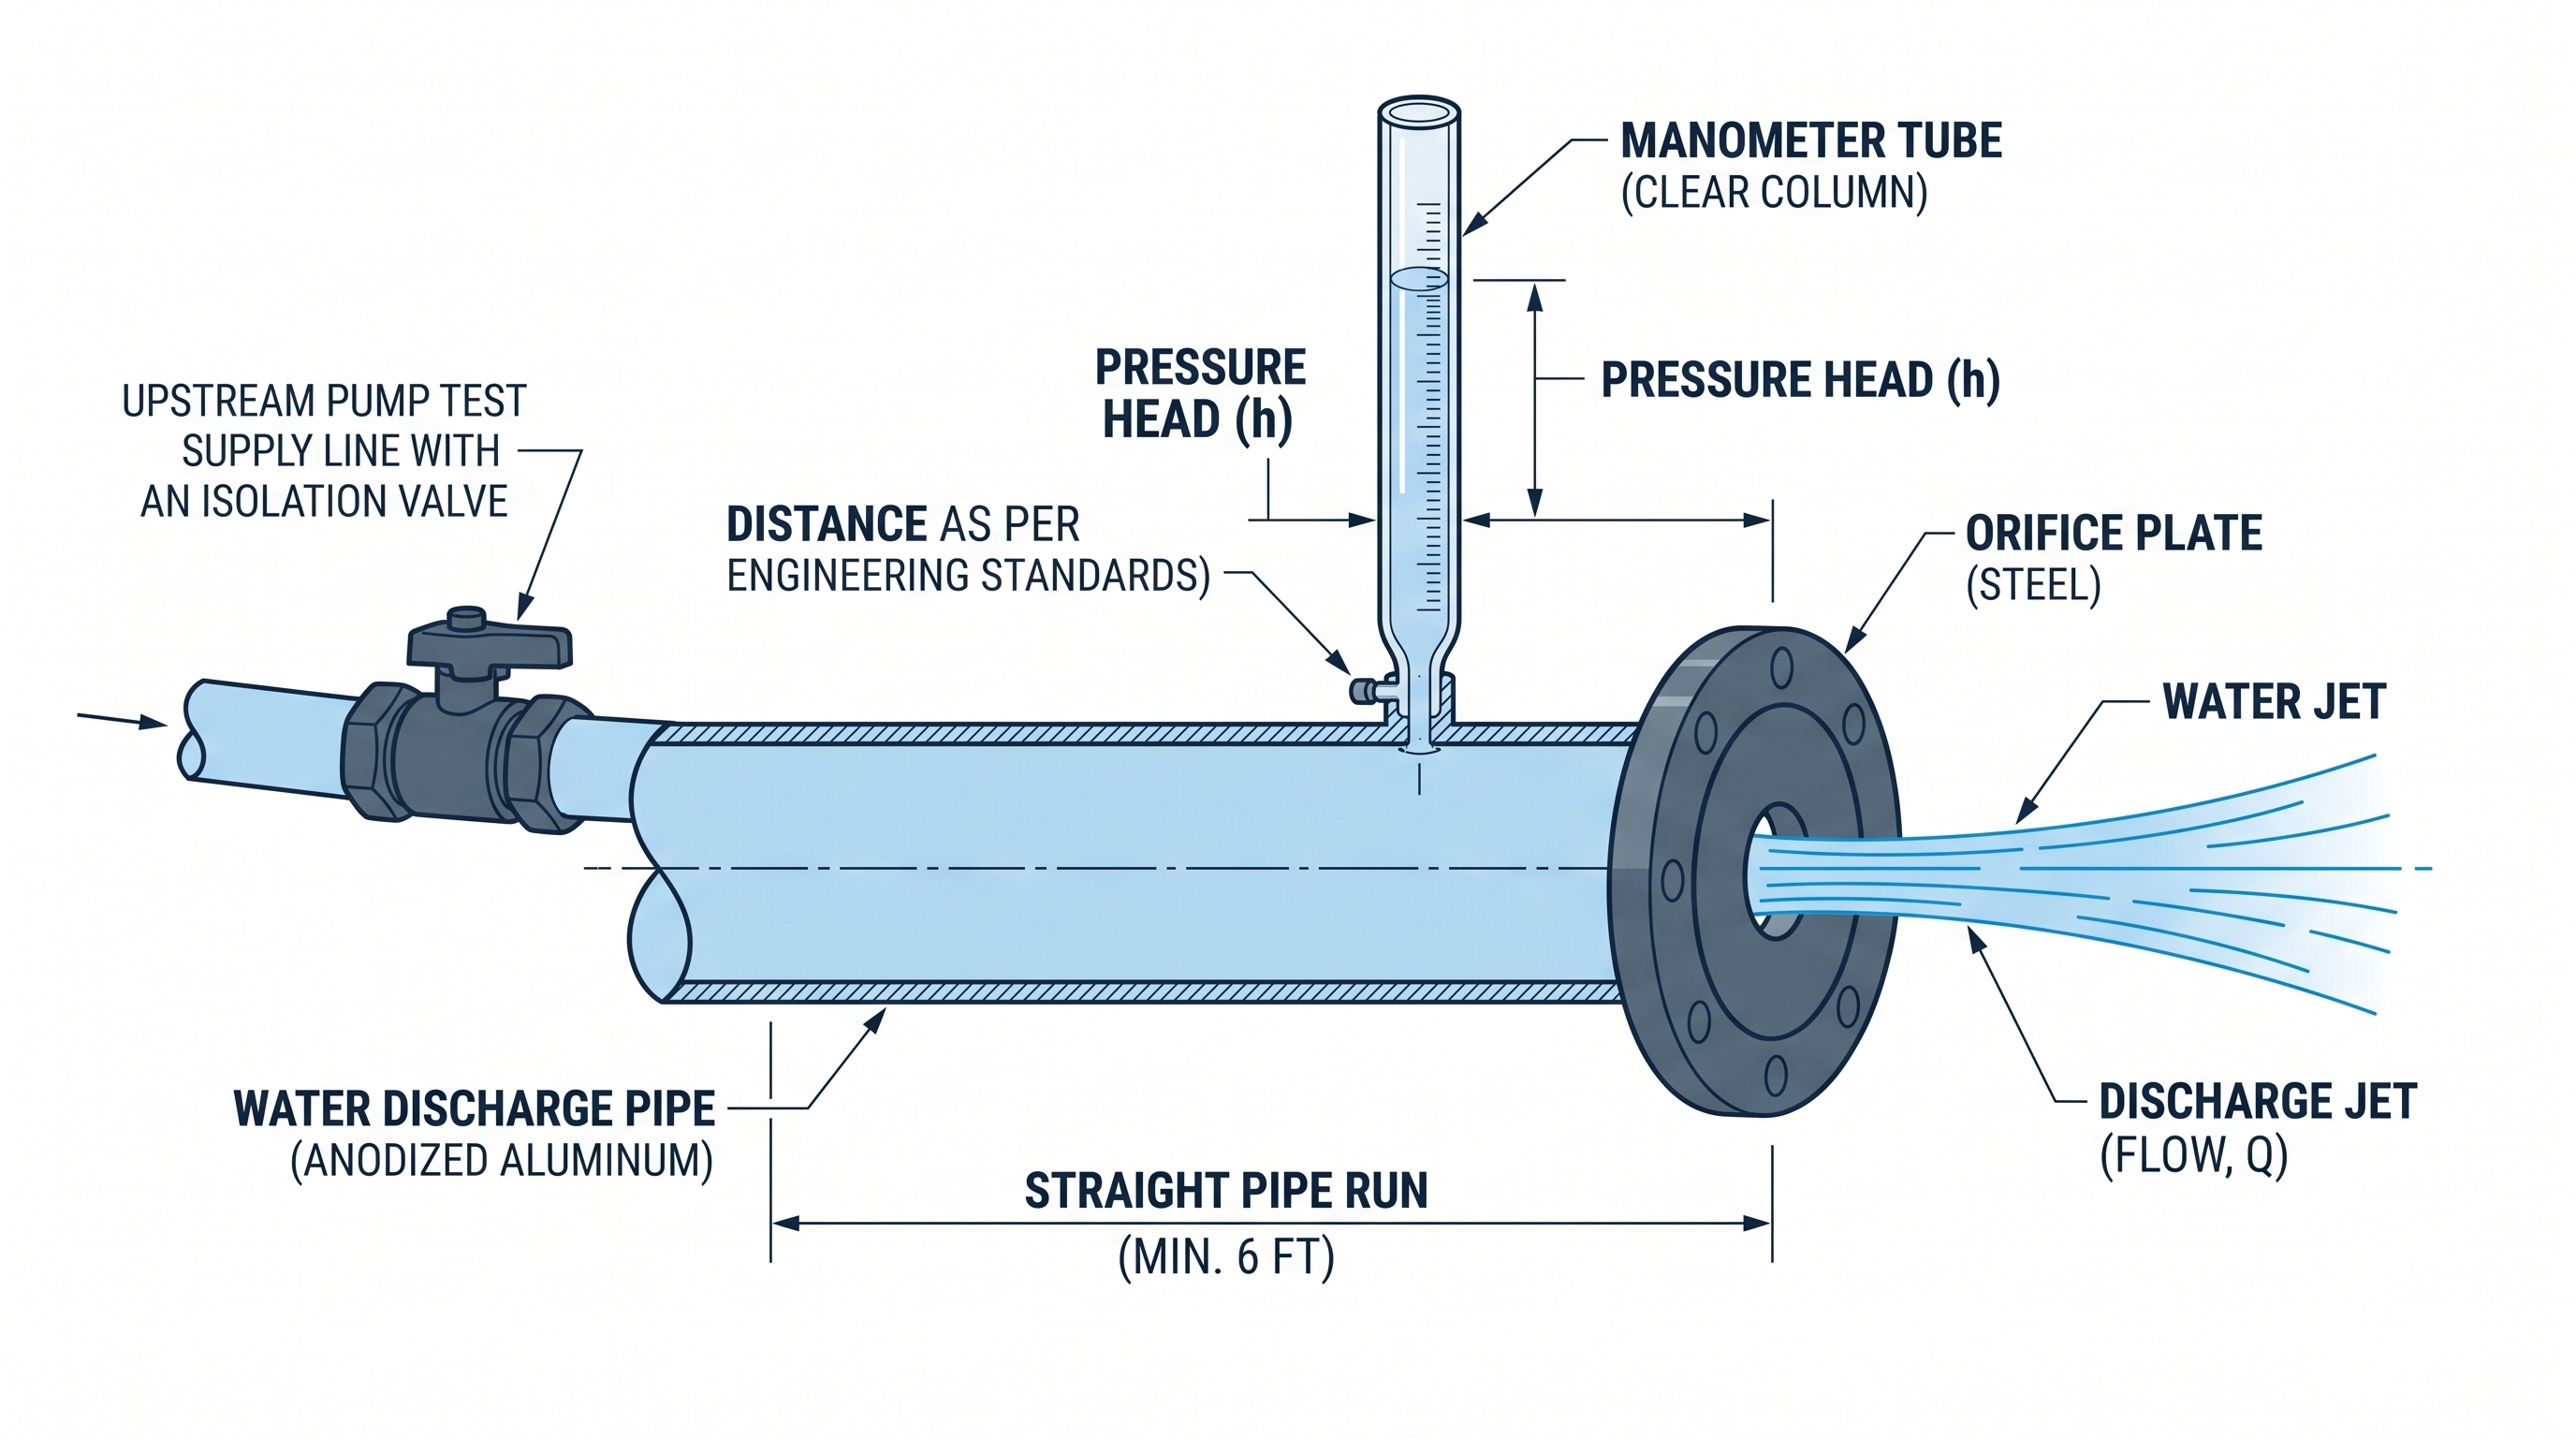
- Orifice weir. A classic, reliable field method. It needs a straight, level run of discharge pipe ahead of the plate, at least six feet, so the flow is settled, and you read the head off a manometer tube.
- Weir or flume in an open channel. A V-notch weir or Parshall flume gives a repeatable rate from a simple head measurement.
- Calibrated container and stopwatch. For low rates, roughly under 10 gpm, nothing beats it. Low-tech, dead accurate, hard to argue with.
Take readings often, frequently in the first hour and then at steady intervals, and hold the rate within a few percent. A rate that wanders makes the drawdown data much harder to interpret.
Measuring drawdown
Use an electric sounder or, better for a real test, a pressure transducer and data logger dropped down a sounding tube so it reads continuously without fighting the pump column. Take readings on a tightening-then-loosening schedule: every minute early when things change fast, stretching out as the curve flattens. Record depths against a fixed, documented reference point, top of casing, every single time, so "water level" means the same thing on every visit.
A pump test is won or lost at the wellhead. Flow, pressure, and water level all have to be read on the same clock, at a rate held steady, against a reference point you document and reuse.
Which step is your specific capacity?
A step test hands you several specific-capacity numbers, one per step, and they will not agree, because specific capacity sags at higher rates as well loss eats into it. Which one do you write down?
Pick the step whose rate is closest to the well's real, day-to-day operating rate, and use that same rate on every future test. The lowest step flatters the well; the highest step punishes it; the operating-rate step is the honest, decision-relevant one. Always report the rate next to the number, "specific capacity = 22 gpm/ft at 500 gpm," and never compare a before taken at one rate against an after taken at another.
In practice, many contractors let the constant-rate test at the service rate supply the headline specific capacity and use the step test to judge efficiency and choose that rate. A clean division of labor. And make sure differences between tests are not the result of the pump operating at a different point on its curve.
Consistency is king, with one exception
If you want to compare a well to its own history, and specific capacity is meaningless if you cannot, you must run each test the way the previous ones were run: same method, same rate, same rest time, same measurement points, same neighbors offline. An apples-to-oranges before/after comparison is worse than no comparison, because it feels like data.
The exception: if you discover that the previous tests were seriously flawed, do not be shy about fixing it. Document the change, explain why, and start a clean new baseline. Perpetuating a broken method just to stay consistent is loyalty to the wrong thing.
The one-page checklist
- Well rested to a stabilized static level; rest period recorded.
- Neighboring wells inside the zone of influence offline or documented.
- Flow measured with a calibrated method; rate held within a few percent.
- Water level logged continuously against top of casing.
- Step test: four or five equal steps bracketing the operating rate; plot s/Q vs Q; report well efficiency.
- Constant-rate test at the operating rate; run long enough to see boundaries; log recovery.
- Power averaged over a steady-state window (for wire-to-water efficiency).
- Specific capacity reported with its rate, and compared only to prior tests at the same rate under the same conditions.
Do that before and after a rehabilitation and you will have a before/after story that survives a skeptical engineer, a skeptical board, and a skeptical CFO.
Get the full field guide
This article is adapted from The Data-Driven Well Rehab, AirBurst's free 60-page field guide for project managers: how to diagnose whether it's the pump, the well, or the aquifer; how to run a pump test you can trust; and how to prove a rehab's results in specific capacity, wire-to-water efficiency, and dollars.